The idea
In the log I gave a simple example. My daily notes have dates. So would a table of the weather, and a table of the rand against the dollar. Line them up on the date and you get a picture of each day across three sources that were never meant to sit together.
The real reason is our work at Evidence Systems. When we pull evidence out of a source document, one source can end up spread across twenty tables: findings, indicators, places, quotes and mapping tables. Each row carries the source's ID, and many carry other IDs too. The links are all there. You just can't see them.
What it does
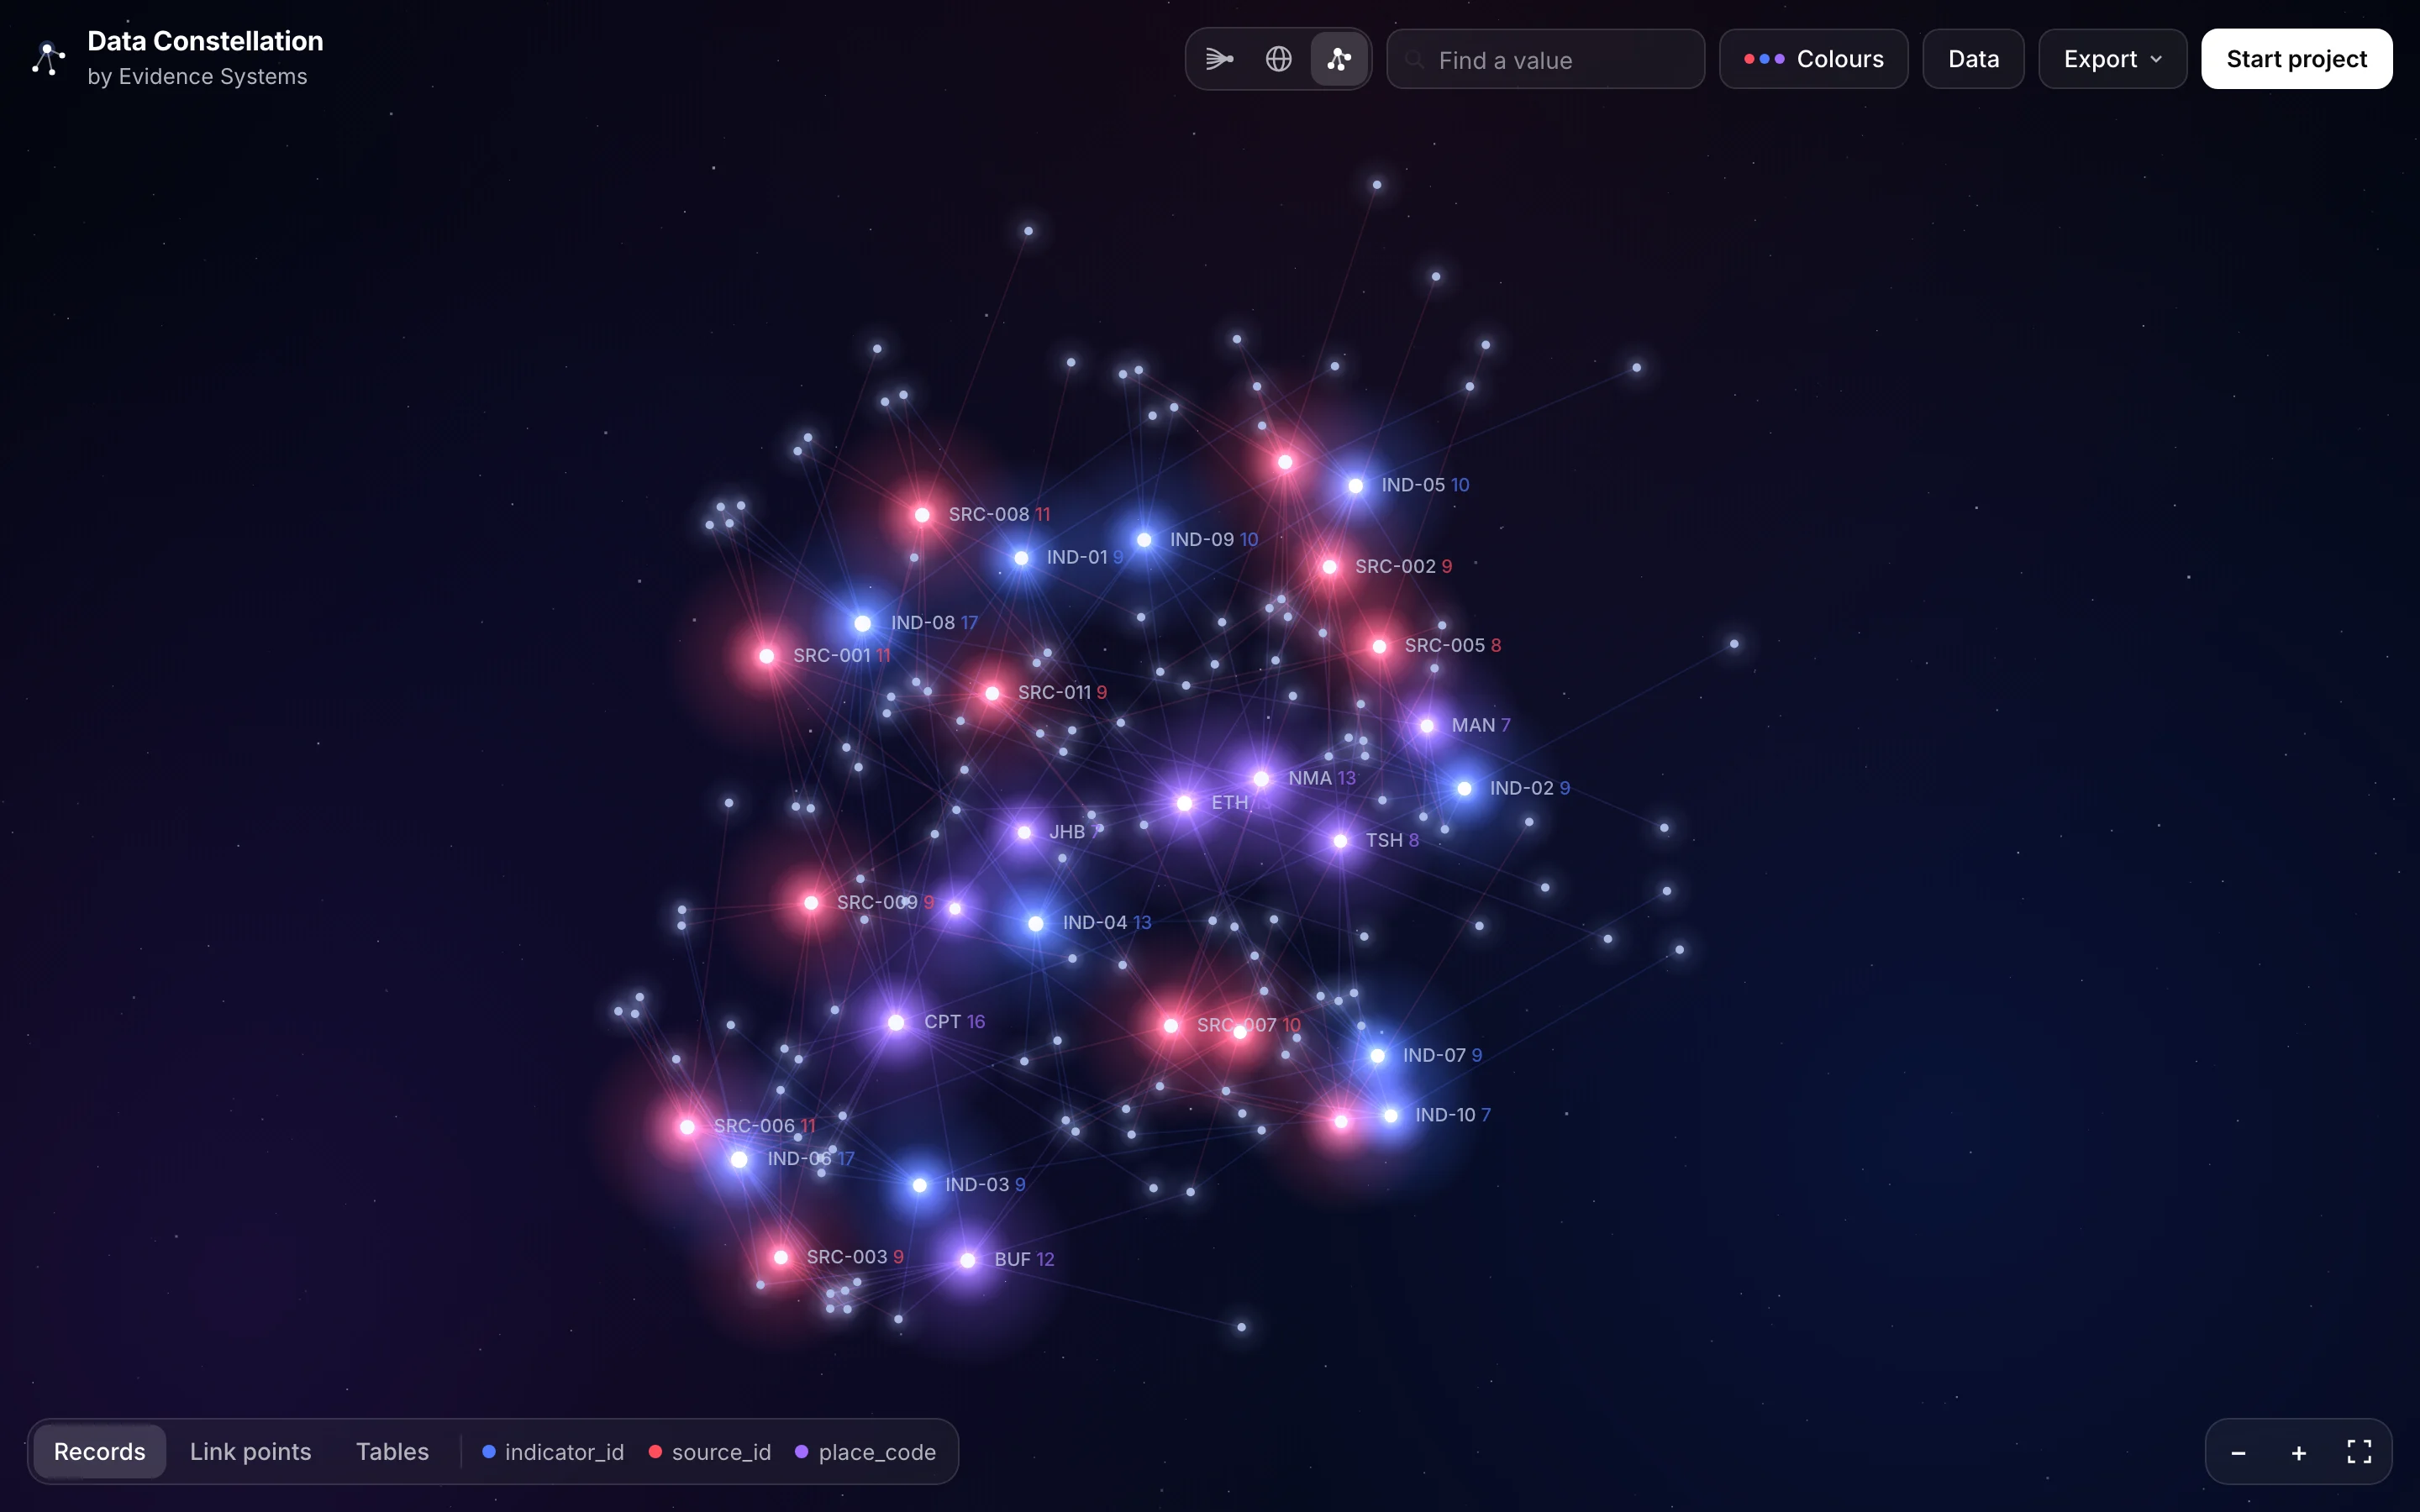
You drop in spreadsheets: CSV, Excel, JSON or a zip of them. The tool reads every column, works out which columns in different tables share values (dates, IDs, codes, names), and turns each shared value into a star. Every record that holds that value is joined to it.
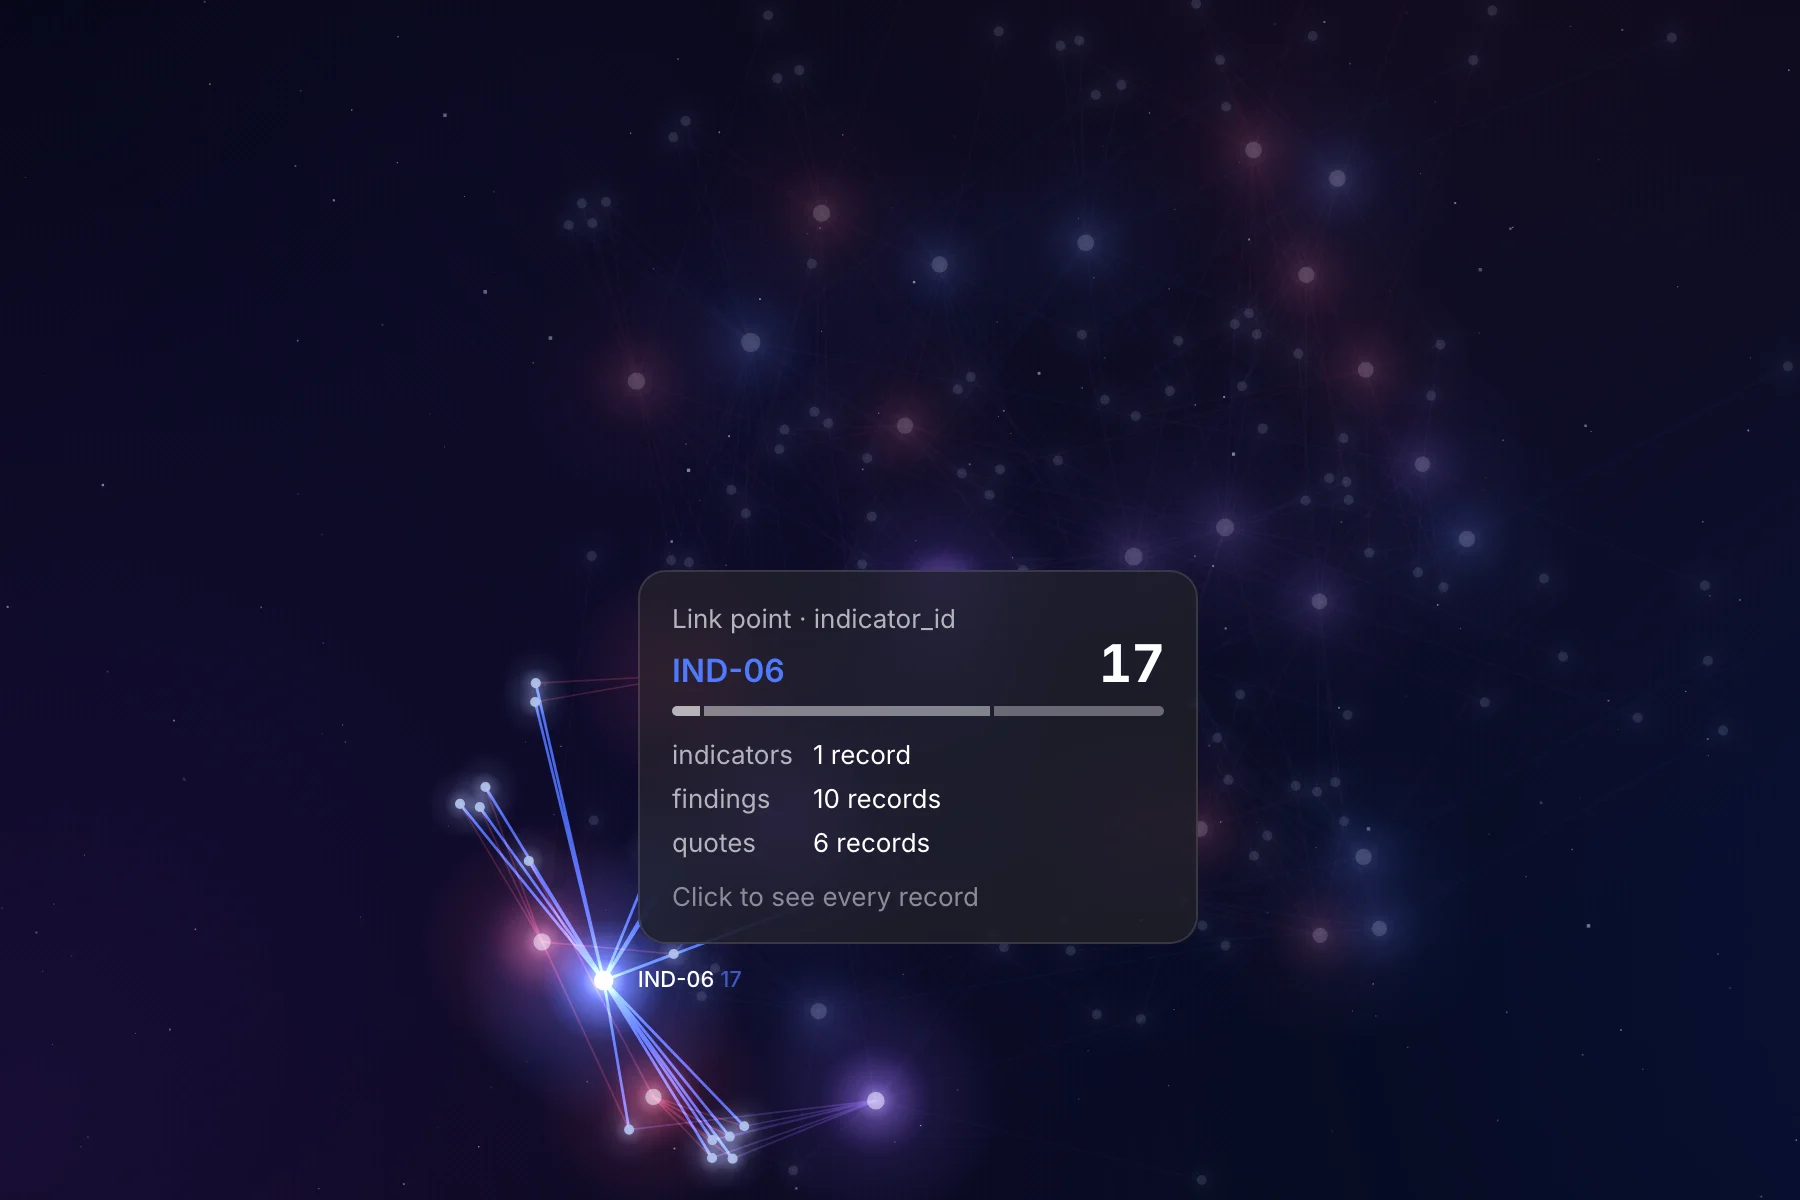
Hover over a star to see how many records hold it and which tables they come from. Click it to see every record behind it. Click a record to see what else it connects to.
Everything happens in your browser. Your files are not uploaded anywhere.
How the day went
The first version was working by mid-morning. I built it with Claude, straight from the log entry: upload, link detection, a clickable graph and two example datasets. It worked, but it looked like a dashboard, with panels down both sides and the graph squeezed into the middle.
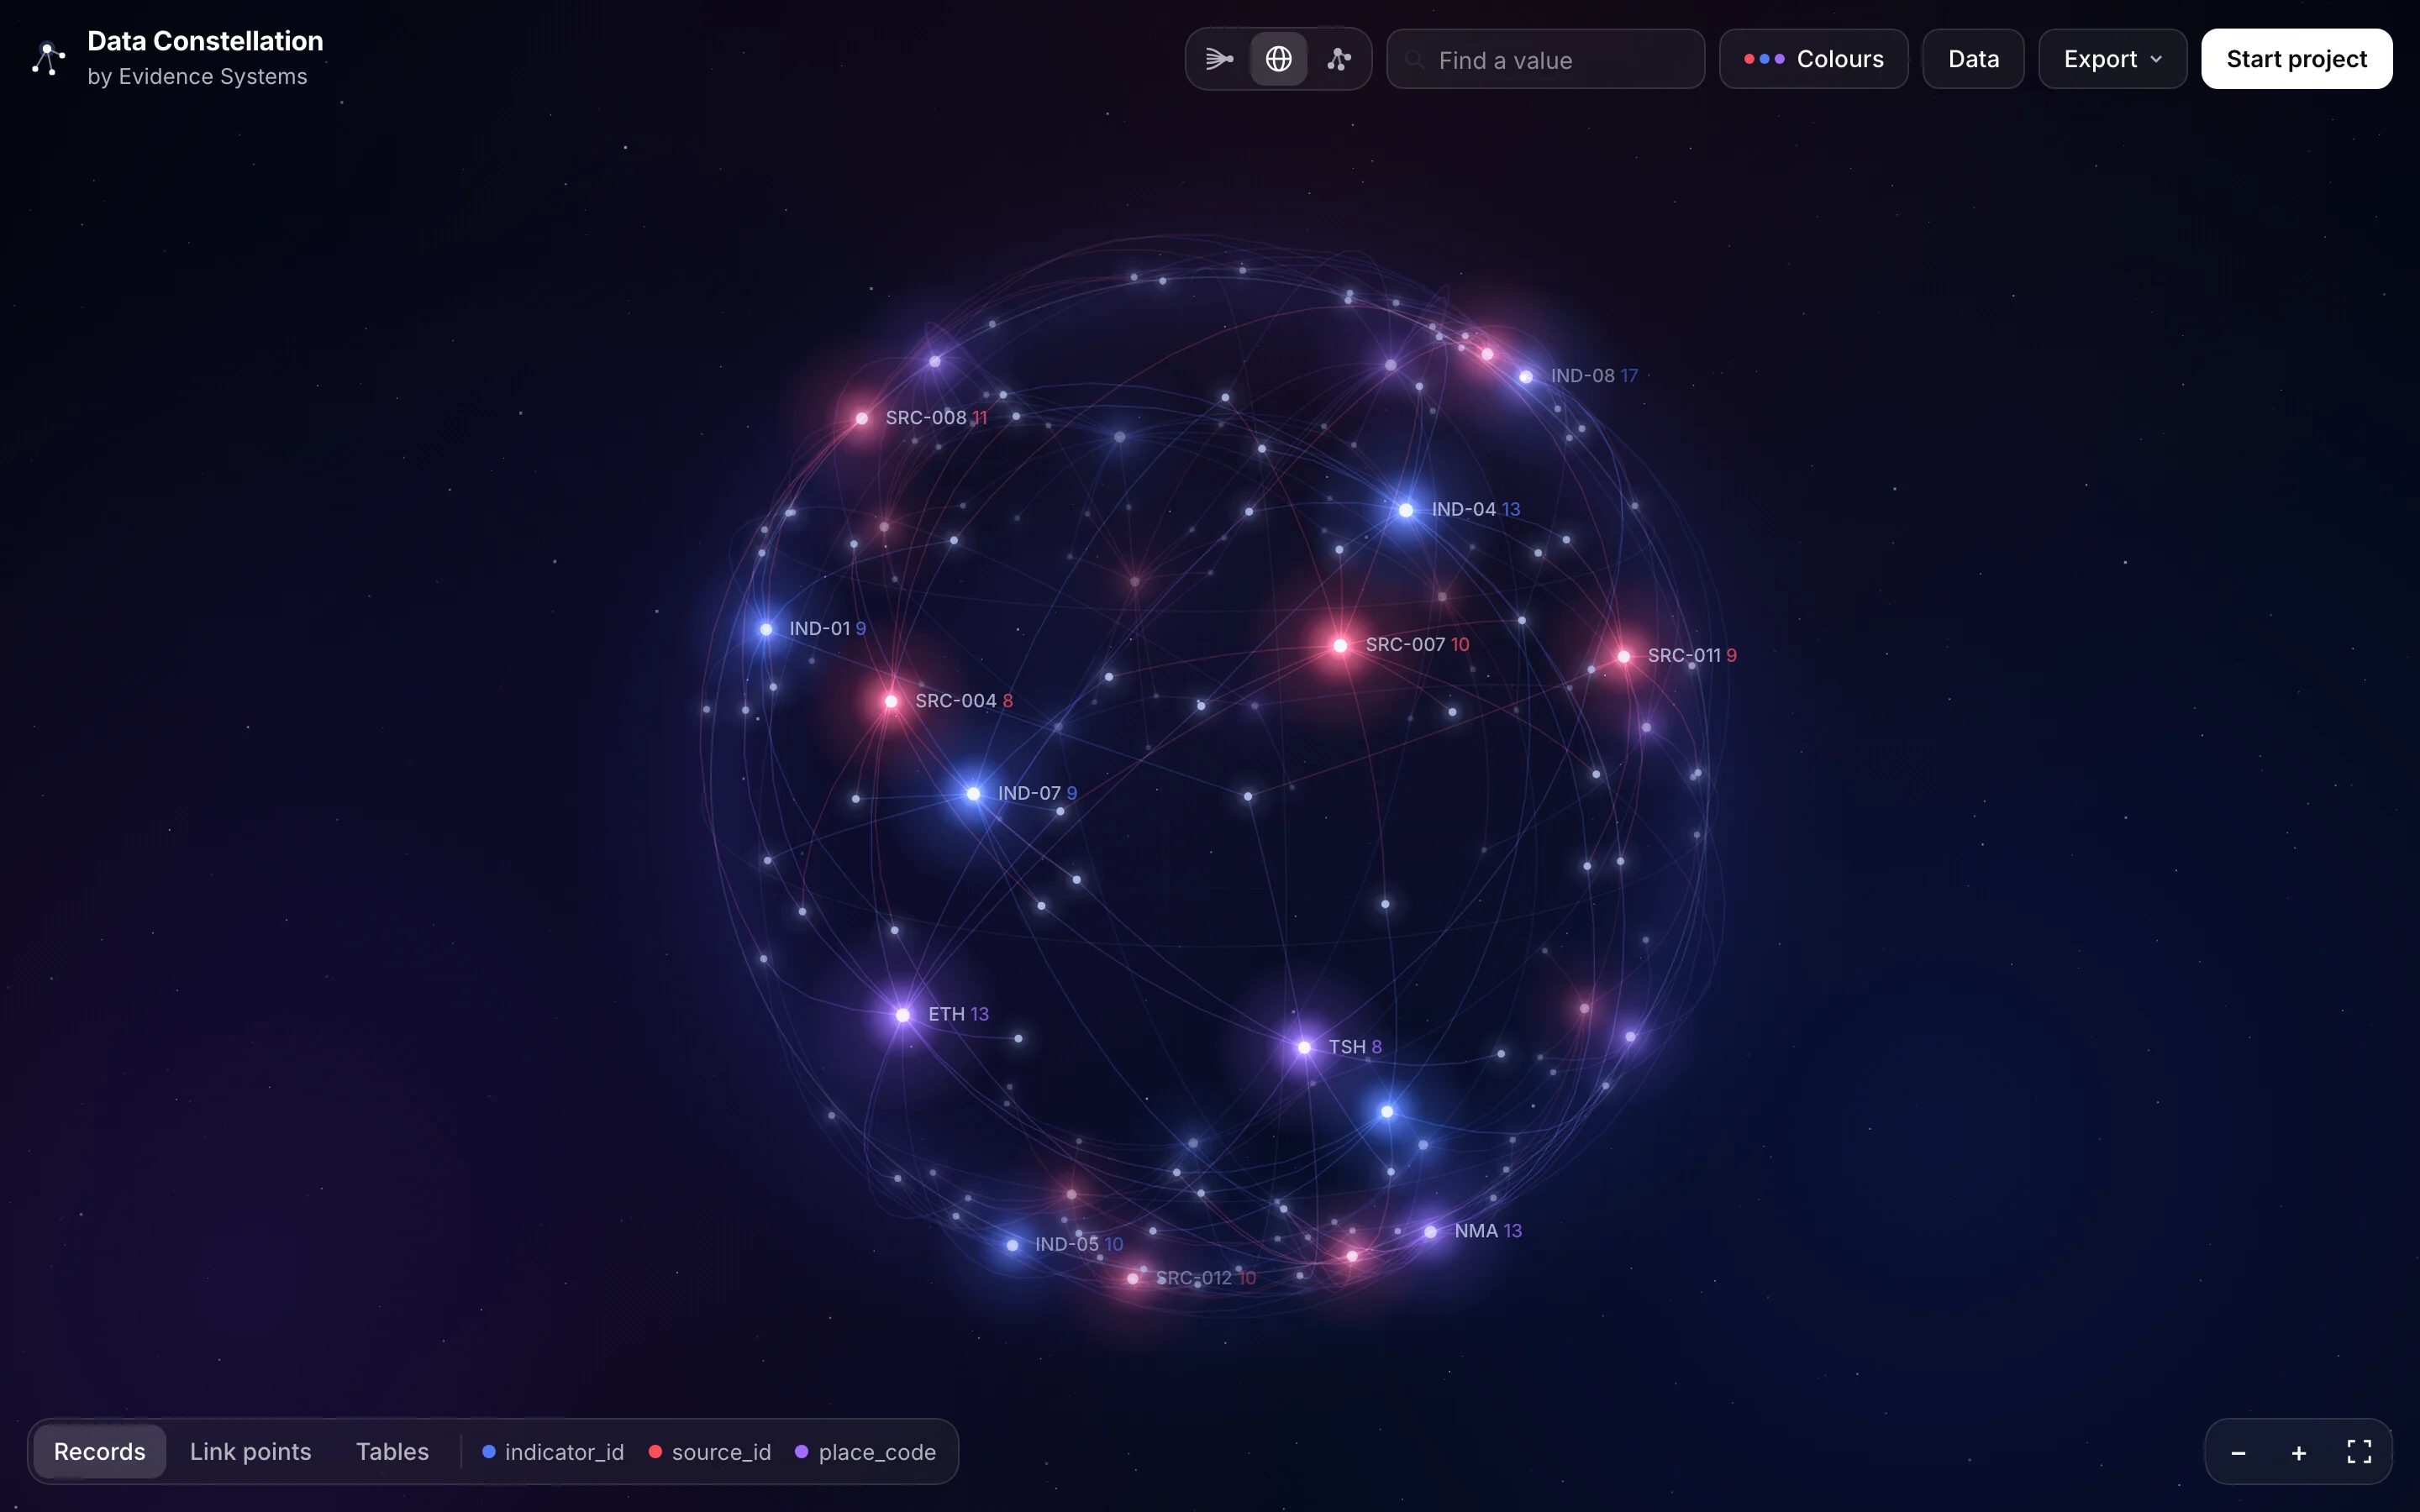
I wanted the constellation to do the talking, so I collected reference images: dark skies, glowing points, thin lines, numbers sitting beside stars. The second version became a night sky that fills the screen. Shared values are the bright stars, records are the faint ones, and the controls stay out of the way at the edges. The colours lead with red, blue and purple, and you can recolour any star, any kind of link or any table yourself.
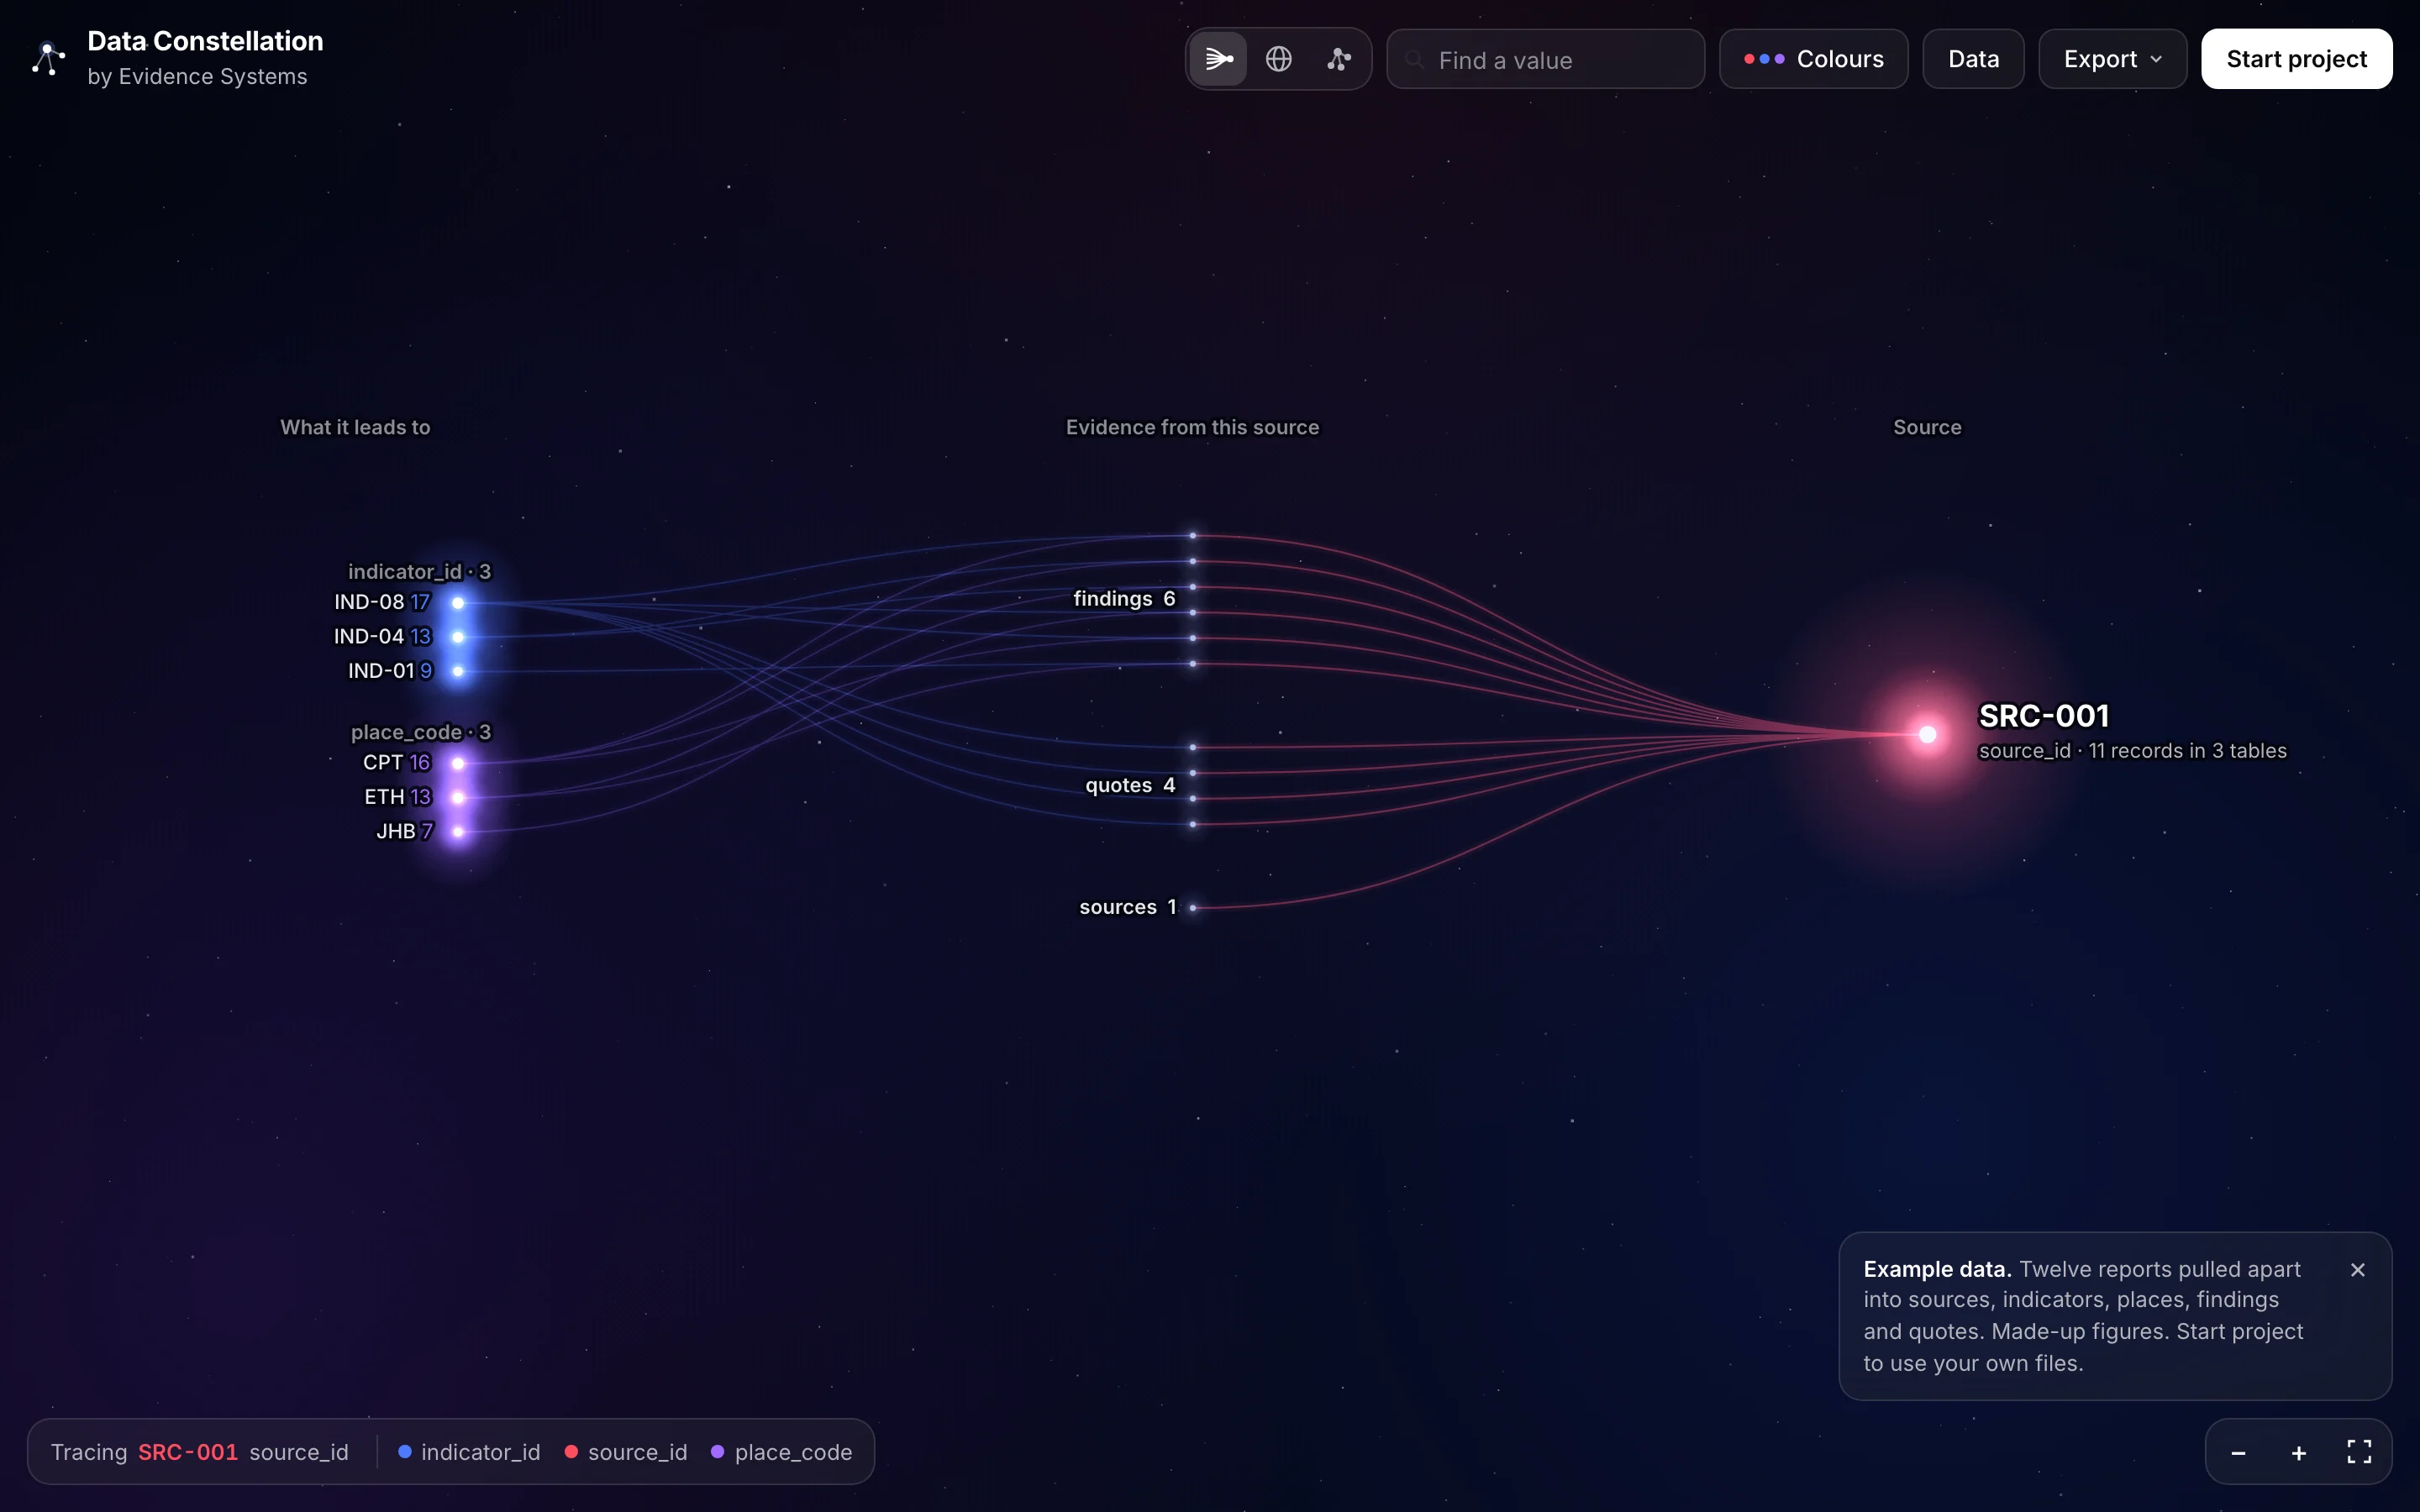
Then two more ways to look at the same data. The Orb puts everything on a slowly turning sphere, with links curving around its surface. Trace starts from one source and fans out, first to every record drawn from it, then to everything those records link to.
Trace is the one I am most excited about, because it is how we work. Every claim should lead back to its source, and Trace draws that path.
Then real data. I exported a source pack from EvidenceOS, our internal evidence tool: one act of Parliament and every row in our research databases that cites it, as 32 tables in a zip. The first attempt drowned in noise. Every table in the pack is about the same source, so dozens of columns held the same value everywhere, and the tool linked all of them. We taught it to open zips, to split cells that hold lists of IDs, to switch off links that only hold a status or a yes or no, and to merge points that join exactly the same records. After that, Trace showed the act fanning out into 266 records across 30 tables, and the evidence they share.
By the end of the day, Claude Code was building the production version for the Evidence Systems site.
What I took from it
- A rough working version beats a long spec. Seeing it made it obvious what was wrong.
- Reference images did more than any description. “Make it look cool” means nothing on its own. Ten pictures meant a lot.
- Real data finds the gaps. The example data was tidy. Our own export was not.
- Writing things down every morning pays off. This started as two sentences in a voice note.
Try it
Data Constellation is free at constellation.evidencesystems.co.za. Start with one of the examples, or drop in your own spreadsheets. More layouts are coming, including rings and timelines.
If you want your own evidence traced like this, that is what we do at Evidence Systems.