
Many South African NPOs already have indicators in proposals, logframes, donor reports, strategy documents or monitoring plans.
The problem is not always that the team has no indicators. The problem is that the indicators are often too vague to collect consistently, disconnected from real data sources, or difficult to use when reports are due.
A useful indicator is not only a sentence in a proposal. It is a measurement rule.
It should make clear what is being measured, where the evidence comes from, who collects it, how often it is reviewed, and how the result will be used in reporting.
SMART indicators can help with that, but the acronym is only the starting point. The real work is turning programme outcomes into indicators that staff can collect, managers can review, and funders or boards can understand.
This guide explains how South African NPOs, donor-funded teams and programme organisations can build SMART indicators that support reporting, learning, evidence review and better decisions.
Quick answer
A SMART indicator should be a repeatable measurement rule with a data source, collection owner, baseline or target where relevant, and a clear reporting use. It only works when it connects to the wider evidence workflow.
Who this guide is for
South African NPOs, donor-funded teams and programme organisations that need clearer indicators, evidence records and reporting outputs
Why indicators matter for reporting and learning
Indicators help teams move from broad intentions to evidence that can be tracked.
A programme might want to improve youth confidence, strengthen food security, increase access to services, support caregivers, improve school retention, or influence policy. Those outcomes may be valid, but they are too broad to report on without clearer measurement.
Good indicators help teams:
- track what was delivered
- understand whether progress is happening
- report to funders and boards
- prepare annual reports and programme updates
- identify gaps across sites or projects
- avoid relying only on stories or memory
- compare results across time
- decide what needs to change
For registered NPOs in South Africa, this also matters because programme records often feed into annual narrative reports, board updates, funding applications, donor reports and internal learning reviews. Registered NPOs must submit an annual report within nine months after financial year-end, and the South African Government says this annual report should consist of a narrative report and financial report. (Government of South Africa)
This does not mean everything important can be reduced to numbers. Some of the most useful evidence in NPO work comes from interviews, field notes, case studies, feedback forms, observations and open-ended responses.
The point is not to replace judgement. The point is to make sure the team has a clear way to connect outcomes, evidence and reporting.
Start with the results chain
Before writing indicators, the team needs to understand what level of change it is measuring.
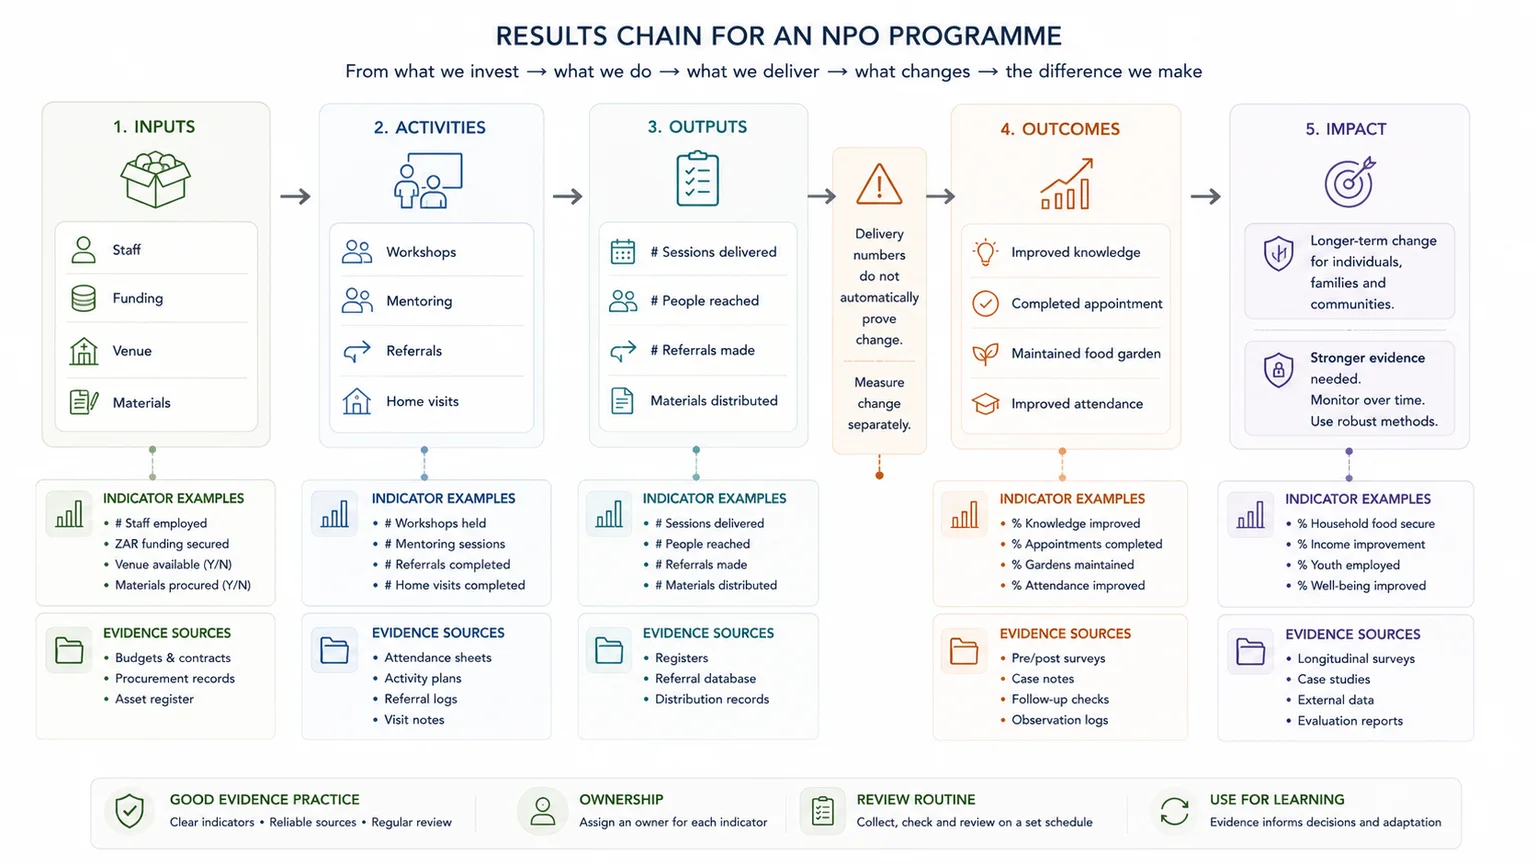
A simple results chain looks like this:
- Inputs
- Activities
- Outputs
- Outcomes
- Impact
Each level answers a different question.
| Level | What it means | Example |
|---|---|---|
| Inputs | Resources used to run the programme | Staff, funding, venues, materials, transport |
| Activities | What the programme does | Workshops, home visits, mentoring, referrals |
| Outputs | What was delivered | Number of sessions held or people reached |
| Outcomes | What changed | Improved knowledge, confidence, access or behaviour |
| Impact | Longer-term change | Reduced food insecurity or improved wellbeing over time |
Most small reporting systems fail when they confuse outputs with outcomes, or when they claim impact without enough evidence.
For example, delivering 20 workshops is an output. It shows what was done. It does not automatically show that participants changed their behaviour, gained confidence or improved their circumstances.
That does not make output data useless. Output data is often essential. But it should not be presented as outcome or impact evidence on its own.
Output indicators vs outcome indicators vs impact indicators
Different indicators serve different purposes.
Output indicators
Output indicators measure delivery.
Examples include:
- number of workshops held
- number of participants enrolled
- number of food parcels distributed
- number of home visits completed
- number of referrals made
- number of training sessions delivered
These indicators help the team show what happened.
Outcome indicators
Outcome indicators measure change.
Examples include:
- percentage of participants who improved their knowledge score
- percentage of caregivers who report improved confidence in accessing services
- percentage of referred beneficiaries who completed an appointment
- percentage of learners who improved attendance after joining the programme
- number and percentage of participants who completed training and applied for work, study or internships
These indicators help the team show what changed, or what appears to be changing.
Impact indicators
Impact indicators measure longer-term change.
Examples include:
- reduction in household food insecurity over time
- improved school completion rates over several years
- sustained employment after training
- improved access to disability-inclusive services across a system
- policy or practice changes that affect a wider group
Impact claims usually need stronger evidence, baseline data, comparison, contribution analysis or evaluation design. Many NPOs can track outputs and early outcomes more easily than impact. That is not a weakness. It is better to report honestly on what the evidence can support than to overclaim.
What makes an indicator SMART?
SMART indicators are:
- Specific
- Measurable
- Achievable
- Relevant
- Time-bound
The acronym is useful because it forces the team to make the indicator clearer. But a SMART indicator still needs a data source, baseline, target, collection method and reporting use.
South Africa’s National Treasury guidance for strategic plans and annual performance plans says programme performance indicators should be reliable, well defined, verifiable, cost-effective, appropriate and relevant, with baseline information and targets where possible. It also says performance targets should be SMART and that institutions need management processes to collect the information needed to track each indicator. (treasury.gov.za)
Specific
A specific indicator says exactly what is being measured.
Weak:
Improve learner confidence.
Better:
Percentage of Grade 10–12 participants who report increased confidence in applying for bursaries or post-school opportunities after completing the mentoring cycle.
What data is needed:
- participant list
- post-programme survey
- confidence question or scale
- programme completion records
Measurable
A measurable indicator can be counted, scored, assessed or reviewed consistently.
Weak:
Participants understand more about nutrition.
Better:
Percentage of participants who improve their nutrition knowledge score by at least 20% between the pre-session and post-session quiz.
What data is needed:
- pre-session quiz
- post-session quiz
- scoring rule
- participant ID or anonymous matching method
Achievable
An achievable indicator is realistic for the programme to influence and for the team to collect.
Weak:
End youth unemployment in the community.
Better:
Number and percentage of enrolled unemployed youth who complete the full skills programme and submit at least one job, internship or training application within two months of completion.
What data is needed:
- enrolment records
- attendance records
- completion status
- application confirmation or self-report with verification where possible
Relevant
A relevant indicator is connected to the programme outcome.
Weak:
Number of social media posts published.
This may be useful for communications, but it may not tell the team whether the programme is achieving its outcome.
Better:
Percentage of referred beneficiaries who complete at least one confirmed appointment with the relevant support service within 30 days of referral.
What data is needed:
- referral tracker
- appointment confirmation
- follow-up record
- referral date and appointment date
Time-bound
A time-bound indicator says when the change or result should be measured.
Weak:
Households maintain food gardens.
Better:
Percentage of participating households that maintain an active food garden three months after receiving starter inputs and training.
What data is needed:
- household enrolment record
- training date
- follow-up visit form
- garden status criteria
- review date
Indicator, target, baseline and data source are not the same thing
One common problem in NPO reporting is that teams use these terms as if they mean the same thing. They do not.
| Term | What it means | Example |
|---|---|---|
| Indicator | What you measure | Percentage of participants who complete the programme |
| Baseline | Where you start | 42% completion rate in the previous cycle |
| Target | What you aim to reach | 70% completion rate by the end of the year |
| Data source | Where the evidence comes from | Attendance and completion tracker |
| Collection method | How the data is collected | Weekly attendance form and end-of-cycle review |
| Reporting use | Where the result appears | Quarterly donor report and board update |
An indicator tells you what to measure. A target tells you what level you want to reach. A baseline tells you where you started. A data source tells you where the evidence comes from.
If any of these are missing, the indicator becomes harder to use.
For example:
Percentage of participants who complete the programme.
This is a reasonable indicator, but it is incomplete on its own. The team still needs to define what “complete” means, when completion is measured, which participants are included, what the target is, and where the source record sits.
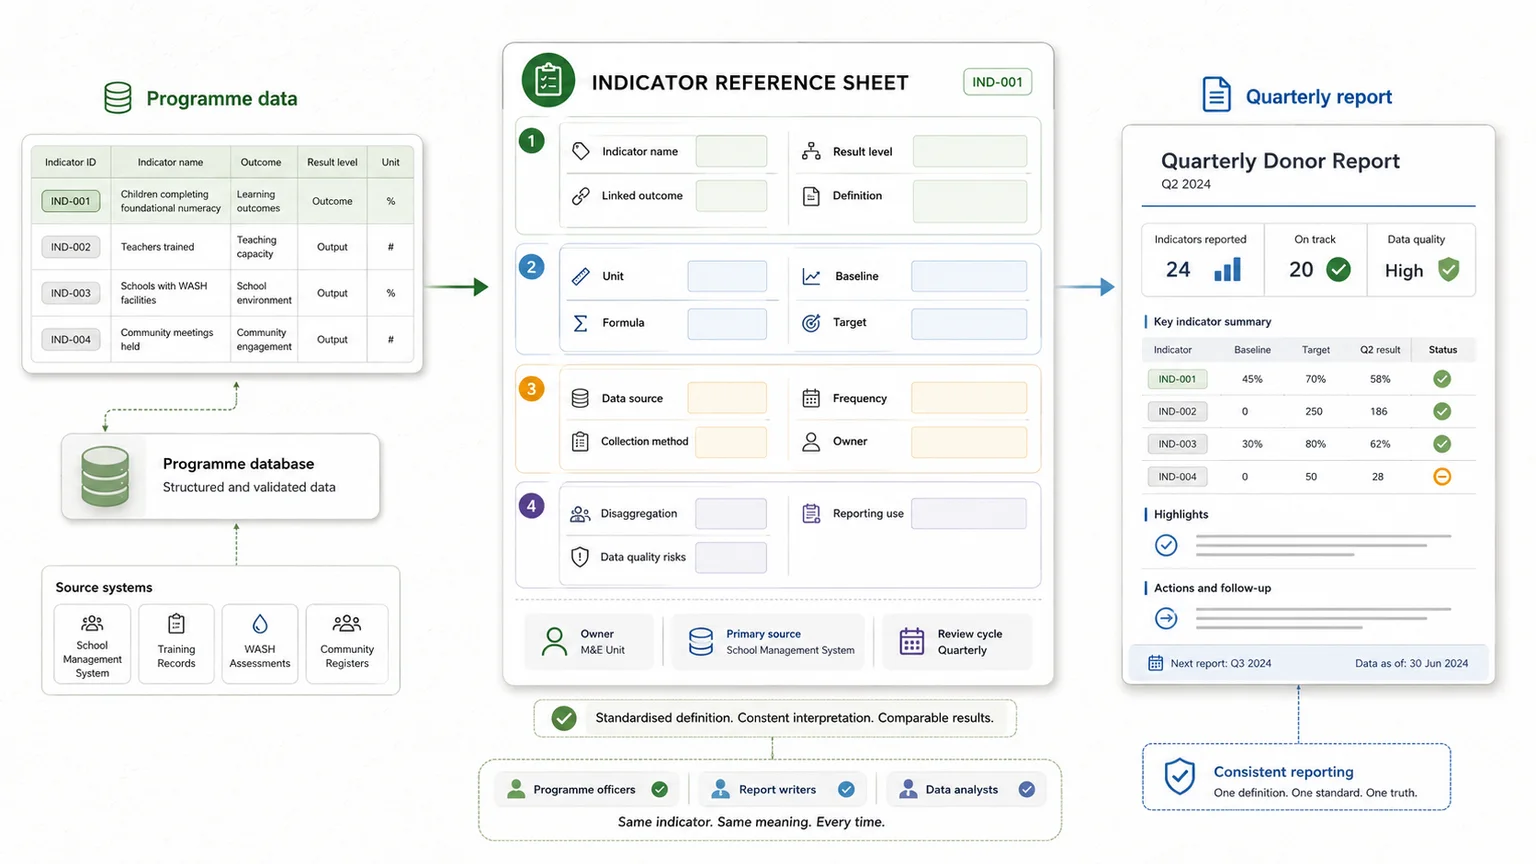
Build an indicator reference sheet
An indicator reference sheet turns an indicator from a sentence into a repeatable measurement process.
This is one of the most useful tools an NPO can create because it stops each report writer, programme officer or donor contact from interpreting the indicator differently.
USAID audit material on performance monitoring explains that precise indicator definitions, data sources and data collection methodologies should be captured in a Performance Indicator Reference Sheet, and notes that unclear or missing reference sheets can lead to misinterpretation and unreliable reporting. (oig.usaid.gov)
A useful indicator reference sheet can include:
| Field | What to define |
|---|---|
| Indicator name | Full indicator wording |
| Result level | Output, outcome, impact, process, quality or assumption |
| Linked outcome | Which Theory of Change or programme outcome it measures |
| Definition | What counts and what does not count |
| Unit of measure | Number, percentage, score, ratio or status |
| Formula | Numerator and denominator, where relevant |
| Baseline | Starting value and date |
| Target | Desired value and date |
| Data source | Where the evidence comes from |
| Collection method | How the data is collected |
| Frequency | Weekly, monthly, quarterly or annually |
| Responsible person | Who owns collection and review |
| Disaggregation | Site, age, sex, location, partner or group |
| Data quality risks | Missing data, double counting, weak verification |
| Reporting use | Donor report, board report, annual report or learning review |
For example, an NPO might define an indicator like this:
| Field | Example |
|---|---|
| Indicator name | Percentage of referred beneficiaries who complete at least one appointment within 30 days |
| Result level | Outcome |
| Linked outcome | Beneficiaries improve access to support services |
| Definition | A completed appointment means the partner confirms attendance or the beneficiary confirms attendance during follow-up |
| Unit of measure | Percentage |
| Formula | Completed appointments within 30 days ÷ total referrals made |
| Baseline | To be established in first quarter |
| Target | 65% by end of year |
| Data source | Referral tracker and partner confirmation |
| Collection method | Referral form, partner follow-up and monthly review |
| Frequency | Monthly |
| Responsible person | Programme coordinator |
| Disaggregation | Site, referral type and age group |
| Data quality risks | Missing partner confirmation, late follow-up, duplicate referrals |
| Reporting use | Quarterly donor report and service access section |
This level of detail may feel slow at first. It saves time later because the team does not need to redefine the indicator each time a report is due.
Teams that need this kind of structure can design a cleaner programme evidence database around indicators, source records, review fields and reporting outputs.
Examples of stronger SMART indicators
The best indicators are specific to the programme. Still, examples can help show what stronger wording looks like.
Youth development
Weak:
Improve learner confidence.
Stronger:
Percentage of Grade 10–12 participants who report increased confidence in applying for bursaries or post-school opportunities after completing the 10-week mentoring cycle.
Why it works:
- defines the group
- defines the change
- gives a point of measurement
- links to a clear data source
Food security
Weak:
Help households grow food.
Stronger:
Percentage of participating households that maintain an active food garden three months after receiving starter inputs and training.
Why it works:
- defines the participating group
- defines the observable result
- includes a time frame
- can be checked through follow-up visits
Skills development
Weak:
Support unemployed youth.
Stronger:
Number and percentage of enrolled unemployed youth who complete the full skills programme and submit at least one job, internship or training application within two months of completion.
Why it works:
- combines completion and next-step action
- includes a clear time frame
- can be linked to programme and application records
Service access
Weak:
Improve access to services.
Stronger:
Percentage of referred beneficiaries who complete at least one confirmed appointment with the relevant support service within 30 days of referral.
Why it works:
- focuses on completed access, not only referral
- includes confirmation
- gives a clear review period
Advocacy
Weak:
Influence policy.
Stronger:
Number of formal policy submissions accepted into the public consultation record during the review period, with evidence of acknowledgement, response or citation.
Why it works:
- defines the output
- requires evidence
- avoids overstating policy influence
Advocacy indicators need care. A submission can be tracked. A policy change may need stronger evidence, time and contribution analysis.
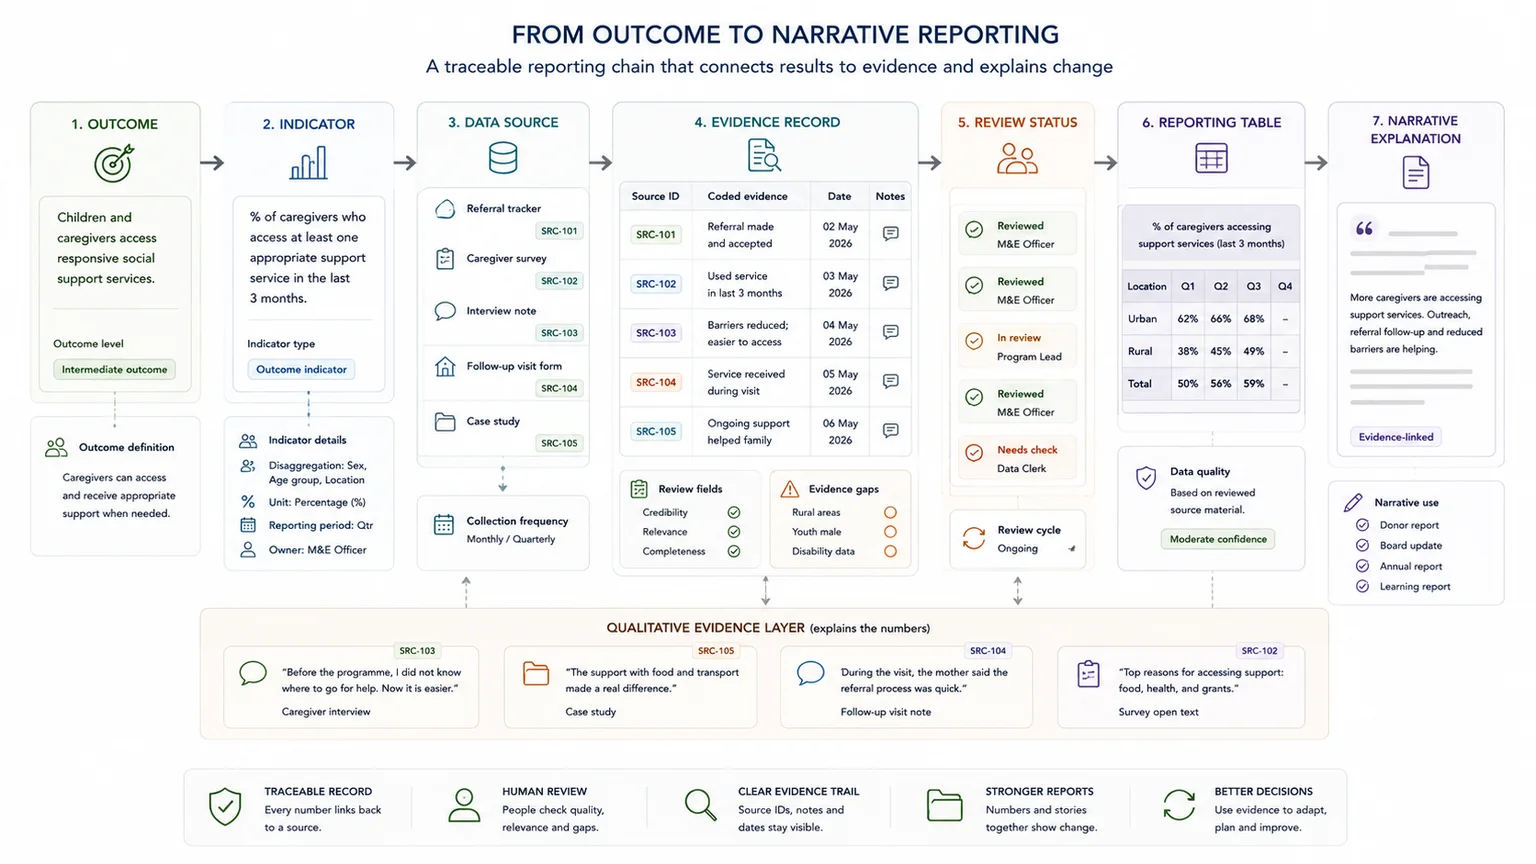
Connect indicators to the reporting workflow
The indicator is only one part of the system. The value comes when the indicator, evidence source, review process and report output are connected.
A practical reporting chain looks like this:
- Outcome
- Indicator
- Data source
- Evidence record
- Review status
- Reporting table
- Narrative explanation
For example:
| Outcome | Indicator | Data source | Evidence record | Reporting use |
|---|---|---|---|---|
| Participants improve access to support services | Percentage of referred beneficiaries completing one appointment within 30 days | Referral tracker and partner confirmation | Referral database with source notes | Quarterly donor report |
| Participants improve confidence | Percentage reporting improved confidence after programme | Post-programme survey and interviews | Survey summary plus coded quotes | Outcome section and case study |
| Households improve food production | Percentage maintaining garden after three months | Follow-up visit form and photos | Site visit records | Annual report or funder update |
This is where indicators become useful for reporting.
The team is not only collecting numbers. It is building an evidence trail that can support claims in reports. The report can show what was delivered, what changed, what evidence supports the claim, and what still needs attention.
Structured indicators can also support qualitative evidence. For example, if a confidence indicator shows improvement, interviews or case studies can explain why confidence improved, what barriers remained, and what participants still need.
This is where teams can turn programme evidence into themes, findings and reporting outputs, instead of keeping indicators, stories and reports in separate places.
For a practical example of structured evidence work, it may help to see how a large qualitative evidence base was structured for reporting.
When SMART is not enough
SMART is useful, but it does not solve every measurement problem.
An indicator can be specific, measurable, achievable, relevant and time-bound, and still fail to answer the question the team really cares about.
For example, an NPO may know how many participants completed a programme, but not why some dropped out. It may know how many referrals were made, but not whether beneficiaries received useful support. It may know that confidence scores improved, but not whether that confidence carried into real decisions later.
Some work needs more than indicators. It may need:
- qualitative evidence
- contribution analysis
- learning questions
- community feedback
- assumption testing
- periodic review
- better source traceability
- deeper evaluation
SMART helps make indicators clearer. It does not replace judgement about whether the indicator actually tells the team something useful.
This is especially important in complex social programmes where change is influenced by many factors outside the organisation’s control. In those cases, indicators should be combined with review meetings, field evidence, stakeholder feedback and careful interpretation.
Common mistakes to avoid
Measuring only activities
Activities are easier to count, but they do not always show change. Track delivery, but also define the early outcomes the programme expects to influence.
Writing vague indicators
Indicators such as “improved wellbeing” or “better access” are not enough unless the team defines how they will be observed.
Setting targets without a baseline
A target is weaker when the team does not know the starting point. For change indicators, establish a baseline where possible.
Choosing indicators because they are easy to count
Some numbers are easy to collect but not very useful. Attendance may be necessary, but it does not explain whether the programme helped participants.
Ignoring who will collect the data
Every indicator needs an owner. If no one is responsible for collection, review and follow-up, the indicator will usually fail in practice.
Collecting data that no one uses
If an indicator does not support reporting, learning, management or decision-making, question whether it belongs in the system.
Treating qualitative evidence as informal
Stories, interviews, field notes and open-ended feedback can support indicators when they are captured, coded, reviewed and linked to outcomes.
Claiming impact from output data
Do not use workshop numbers or attendance records to claim long-term impact. Use them to show delivery. Outcome and impact claims need stronger evidence.
Not linking indicators to a Theory of Change
Indicators make more sense when they are linked to the programme logic. If there is no clear outcome pathway, the team may collect data that is hard to interpret.
Teams that are still shaping the programme logic can start with a clear Theory of Change before finalising indicators.
Not connecting indicators to reporting templates
A good indicator should have a clear place in the reporting workflow. Otherwise, staff may collect data that never appears in donor reports, board updates or learning reviews.
For recurring reporting cycles, it also helps to build a practical M&E reporting workflow around indicators, evidence sources, review steps and report outputs.
Before a major report, funding renewal or AI-supported summary, teams can check whether their evidence trail is strong enough.
Practical SMART indicator templates
These templates can help teams move from vague outcomes to usable measurement.
Template 1: Basic SMART check
| Question | Notes |
|---|---|
| Specific | What exactly are we measuring? |
| Measurable | Can we collect or review the evidence consistently? |
| Achievable | Is this realistic for the programme to influence and track? |
| Relevant | Does it connect to the outcome we care about? |
| Time-bound | When will it be measured? |
| Data source | Where will the evidence come from? |
| Reporting use | Where will this result appear? |
This template is useful for improving weak indicators before adding them to a proposal, logframe or monitoring plan.
Template 2: Indicator reference sheet
| Field | Notes |
|---|---|
| Indicator name | |
| Result level | |
| Linked outcome | |
| Definition | |
| Unit of measure | |
| Formula | |
| Baseline | |
| Target | |
| Data source | |
| Collection method | |
| Frequency | |
| Responsible person | |
| Disaggregation | |
| Data quality risks | |
| Reporting use |
This template is best for indicators that the team will use repeatedly across reporting cycles.
Template 3: Outcome-to-reporting map
| Outcome | Indicator | Source material | Collection method | Review step | Report section | Evidence gap |
|---|---|---|---|---|---|---|
This is the most useful template when the team already has indicators but reporting still takes too long.
It helps connect the result the programme wants, the indicator being tracked, the source material behind it, the review step, and the final report section.
Once this is clear, the team can turn structured evidence into report-ready sections instead of rebuilding reports manually.
When to get external help
External support is useful when indicators exist on paper, but the team cannot use them easily in reports.
That usually happens when source material sits across forms, spreadsheets, PDFs, field notes and stories; outcome indicators are vague; qualitative evidence is hard to use; or donor reports depend too much on manual copying and memory.
I help teams turn indicators, source material and reporting requirements into structured evidence workflows. That can mean a cleaner programme database, indicator reference sheets, source-linked evidence tables, reporting templates, AI-assisted summaries with review steps, or a practical workflow that helps the team produce clearer reports faster.
For teams with recurring reporting pressure, it may also help to build a more structured evidence and reporting system around the indicators, source records and report outputs.
Related guides
These adjacent guides are useful when this workflow needs a tighter next step: source register, reporting workflow, source traceability. Also see M&E reporting workflow.
FAQ
What is a SMART indicator?
A SMART indicator is Specific, Measurable, Achievable, Relevant and Time-bound. In practice, it should also have a clear data source, collection method, baseline, target and reporting use.
What is the difference between an indicator and a target?
An indicator is what you measure. A target is the level you aim to reach by a specific time.
For example, “percentage of participants completing the programme” is an indicator. “75% completion by December 2026” is a target.
What is the difference between output and outcome indicators?
Output indicators measure what the project delivered. Outcome indicators measure what changed for participants, communities, organisations or systems.
For example, “number of workshops held” is an output indicator. “percentage of participants who improved their knowledge score” is an outcome indicator.
How many indicators should an NPO project have?
There is no fixed number. A smaller project is usually better served by a few well-defined indicators than by a long list that no one can collect or use properly.
Do all indicators need baselines?
Any indicator that measures change should have a baseline or a clear plan for establishing one. Without a baseline, it is difficult to judge progress.
Output indicators may not always need a baseline in the same way, but they still need targets and clear definitions.
Can qualitative evidence support indicators?
Yes. Interviews, case studies, field notes and open-ended feedback can support indicators when they are collected consistently, coded clearly and linked to the relevant outcome.
Qualitative evidence is especially useful for explaining why a result changed, what barriers remain, and what the numbers do not show.
Can AI help with indicator reporting?
AI can help summarise, classify or draft from structured source material, but it should not replace human review. The source records, indicator definitions and evidence trail need to be clear first.
What makes an indicator report-ready?
An indicator is report-ready when it has a clear definition, data source, collection owner, baseline or target where relevant, review frequency and reporting use.
How do SMART indicators connect to evidence?
SMART indicators only help reporting when the team can show where the data comes from, who collects it, how it is checked, and how it supports the outcome being reported.
SMART indicators should become usable evidence
SMART indicators are useful because they make measurement clearer. But the acronym is not enough on its own.
A good indicator should connect the programme outcome to a data source, collection method, review process and reporting use. It should help the team explain what was delivered, what changed, and what evidence supports the claim.
For South African NPOs and donor-funded teams, the practical goal is not to create a perfect indicator list. It is to build a measurement process the team can actually use.
That means fewer vague indicators, clearer definitions, better source records, and reporting templates that connect back to the evidence.
Need to turn indicators into a reporting system your team can actually use?
I help NPOs, donor-funded teams and programme organisations connect outcomes, indicators, source material, evidence tables and reporting templates into practical workflows.
Send a short project brief, or start by checking whether your current evidence trail is strong enough.
Data Use, Reporting & Communication Systems
Use structured data in reports, dashboards, internal tools, public microsites, applications, presentations, annual reports, and decision-support workflows.